Convection Modelling Tutorial
A tutorial original developed for the CIDER 2016 summer programme at the Kavli Institute for Theoretical Physics at UC Santa Barbara. This tutorial is meant to be tackled sequentially, starting from notebook zero (Overview). Maintainer: Louis Moresi.
You can run these notebooks live on http://www.mybinder.org but be aware that your work will not be saved unless you download it. You may also run out of time to complete the exercises as the mybinder site is a public, shared resource.
![]()
List of Notebooks in the convection tutorial
- 000-Overview.ipynb
- 010-Introduction.ipynb
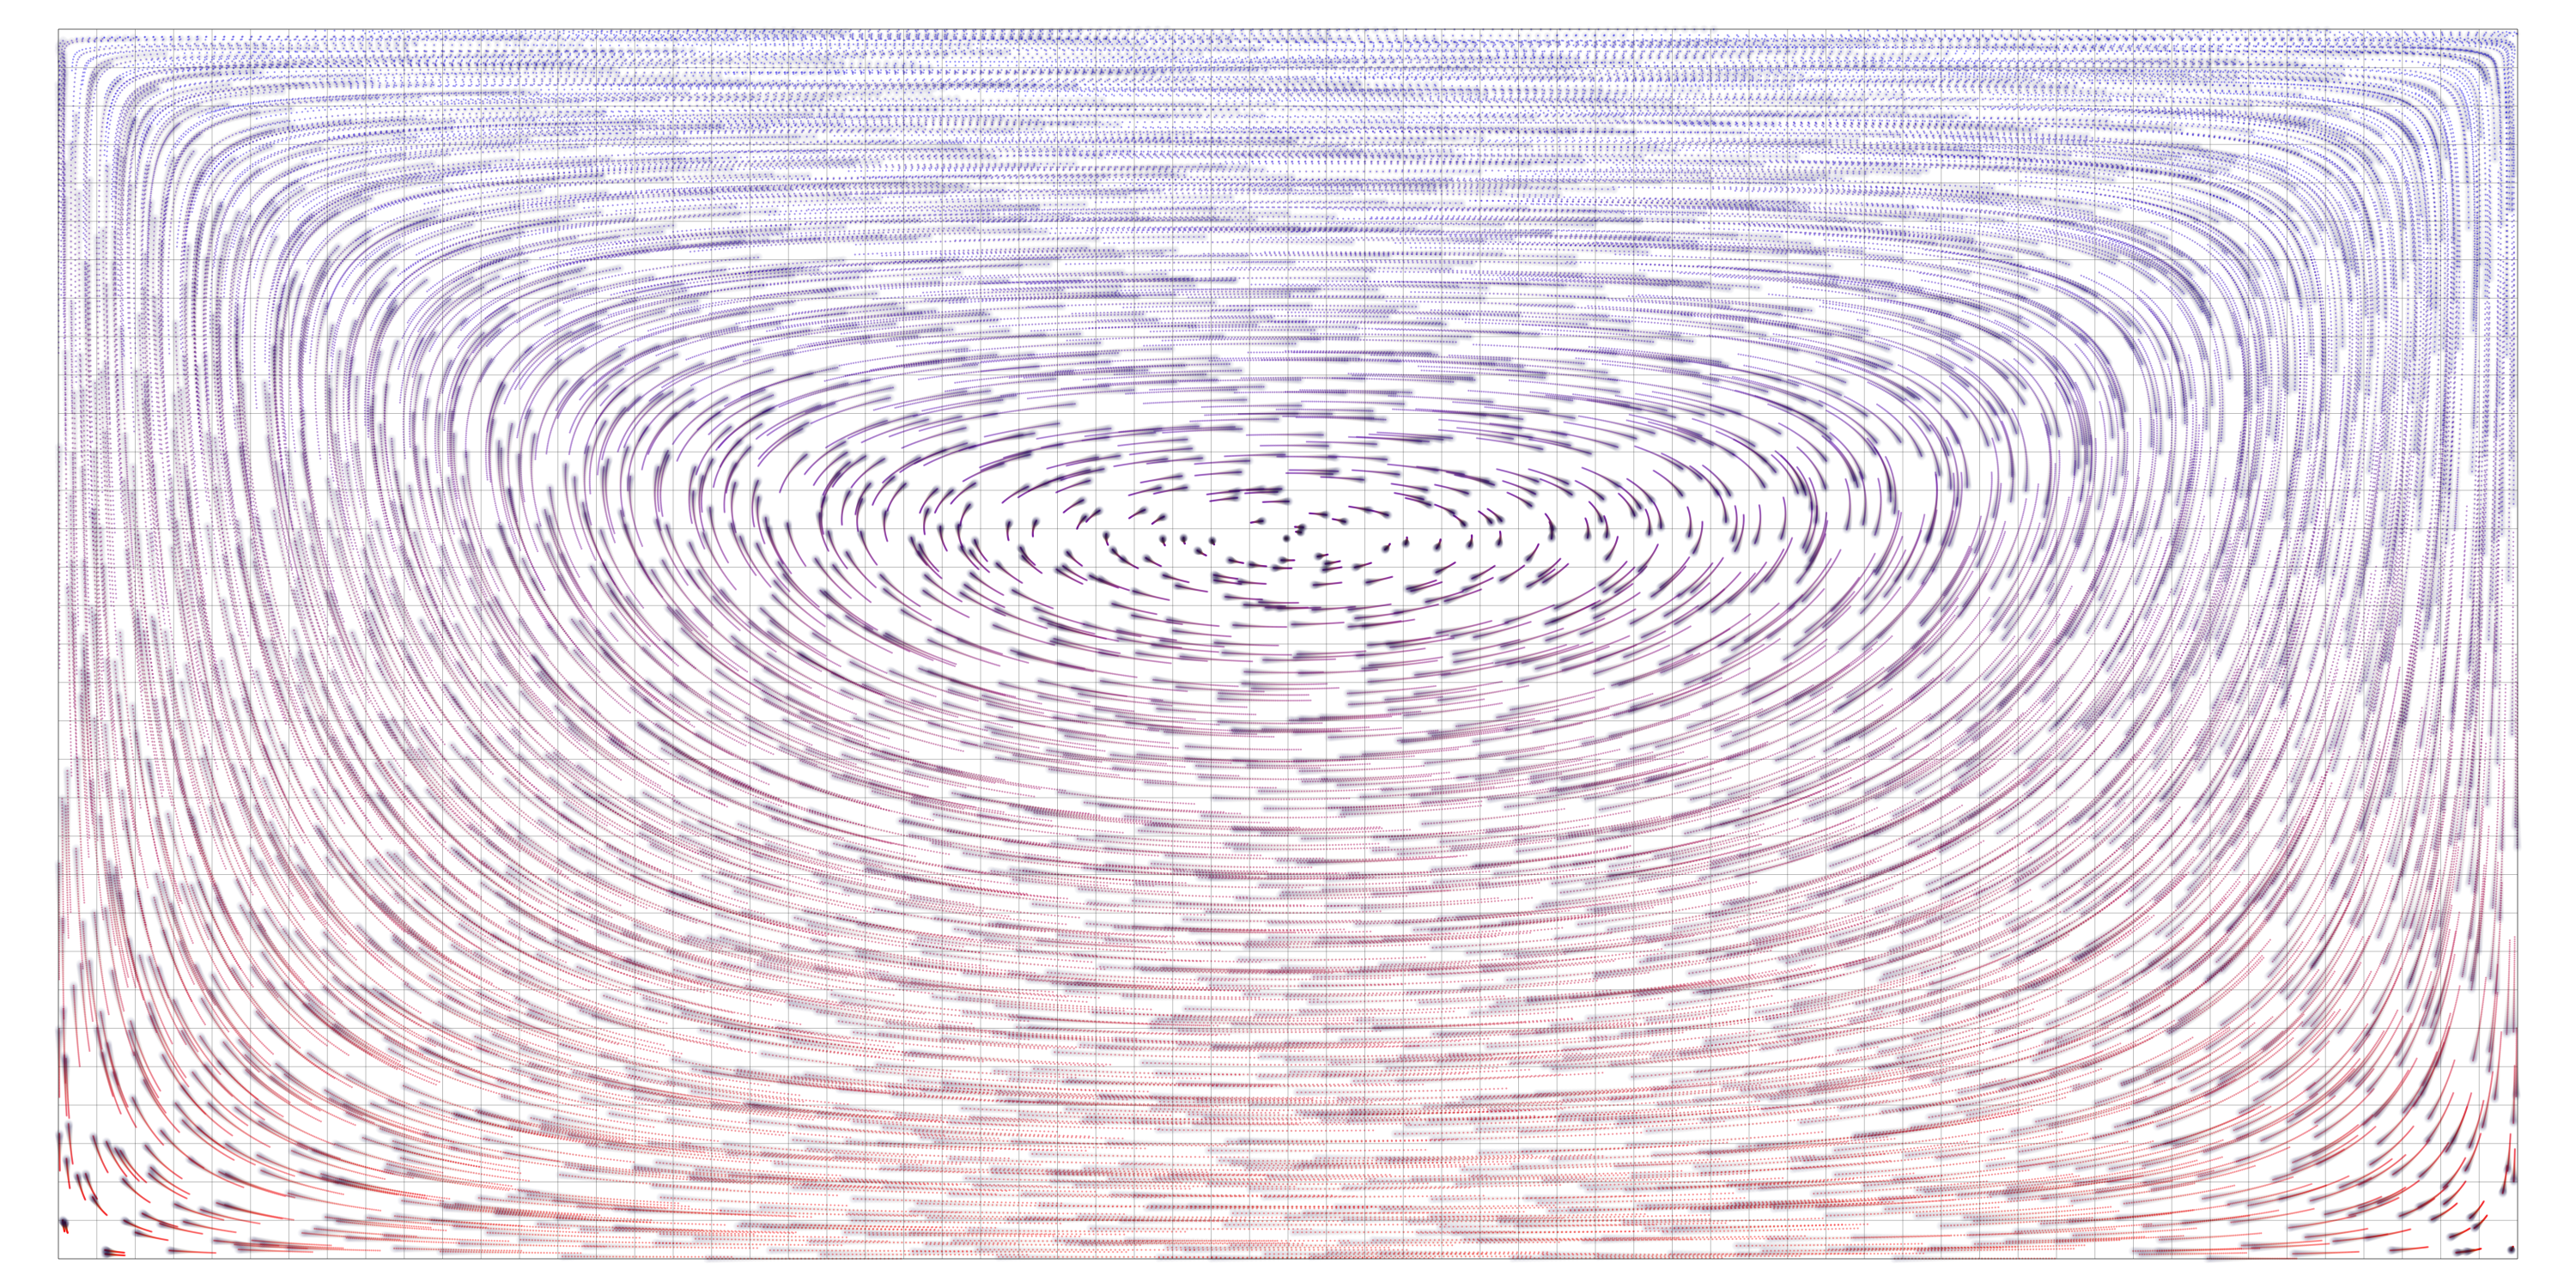
- 020-LidDrivenFlow.ipynb
- 021-Exercise-PointSource.ipynb
- 022-Exercise-PointSource-Solution.ipynb
- 030-ThermalBuoyancy.ipynb
- 040-LidDrivenFlowPlusTracers.ipynb
- 042-Exercise-StreakPlot-Solution.ipynb
- 050-RayleighBenardConvection.ipynb
- 051-RayleighBenardConvection-pt2.ipynb
- 051a-RayleighBenardConvection-pt2a.ipynb
- 051b-RayleighBenardConvection-pt2b.ipynb
- 051c-RayleighBenardConvection-pt2c.ipynb
- 052-RayleighBenardConvection-pt3.ipynb